-1.png?width=113&height=50&name=HaulHub%20EDOT%20Logo%20(color-trans%20bg)-1.png)
Last Updated: 03/10/2021
Overview:
Take advantage of HaulHub Field visibility and transparency with trip cost analytics while a job is running and after it is completed.

- You must have the HaulHub Field app installed on your mobile device.
- Click here to download the app on Android or iOS
- Use the same login info on the app as you do on web
General Information
After logging in the app you will notice the Date Bar at the top.

- There will be a colored dot beneath each date that represents a job. This is a simple way to quickly reference the number of scheduled and cancelled jobs that day.
- Dark Blue dots reflect upcoming or in progress jobs.
- Faded Blue dots reflect completed jobs.
- Red dots reflect cancelled jobs.
-
Above the Date Bar is a simple performance scorecard.
- The +/- number reflects:
- How many jobs you beat your target bid cost on
- Or if negative, how many jobs you ran at higher cost relative to the total jobs scheduled that day.
- The +/- number reflects:
Example:
- Let’s say you have four jobs scheduled to run on a day.
- Three of those four jobs ran more efficiently at a lower cost than your targeted bid for that job.
- The fourth job did not run as efficiently as you thought and thus your cost per shift on average was too high.
- This would result in a +2 above that date on the app because you were net 2 jobs positive on the day.
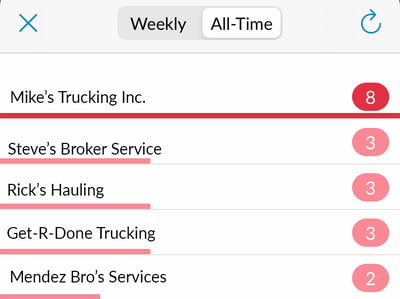
Fleet Cancellations
Easily track cancellations by selecting Fleet Cancelation from the left menu.
This will keep the frequency of Weekly and All Time cancellations to help you make more informed decisions.
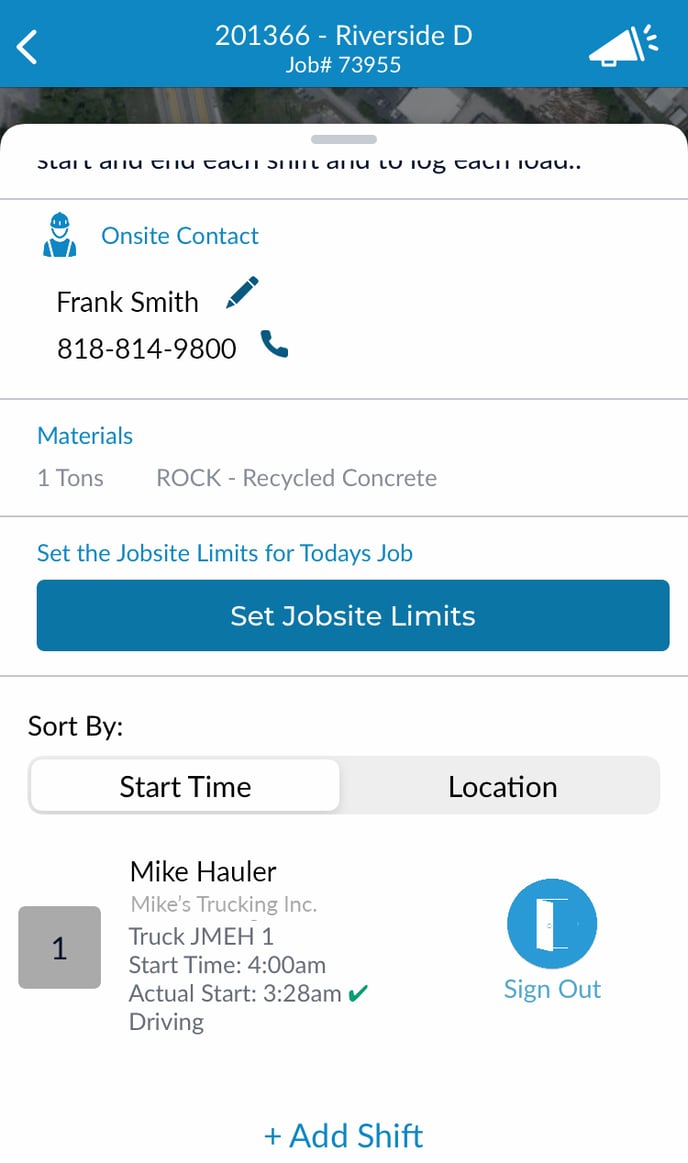 Truck Tracking
Seamlessly track where trucks are on the road and how long they have been at a given destination.
- By selecting a job you will have a bird’s eye view of where the trucks are relative to the start and end locations.
- Access truck details and contact information of any driver by swiping up to access the driver line up.
- Select a driver to view the tickets uploaded and route details as the job progresses.
- This highlights plant start time and transit times for each cycle.
- This highlights plant start time and transit times for each cycle.

- At the top left you will see a Play button. Analyze truck routes by reviewing the play back of the day.
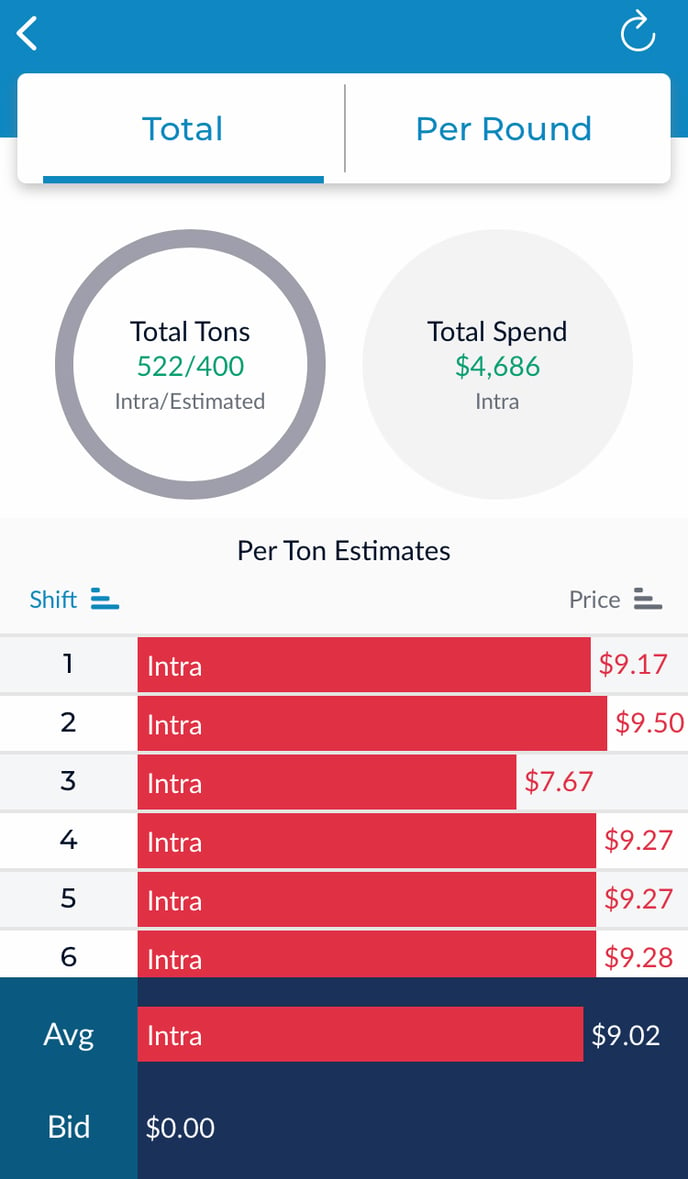 Cost Tracking
You can review cost analytics of most jobs while in progress and once completed.
- Select the $ button from the top right.
- Some job types such as Rock and Construction jobs, however, do not provide these metrics.
- Asphalt Machine Paving:
- Total tons loaded vs estimated
Total spend(cost) - Avg hourly/tonnage cost per truck
- Avg Job Hourly/Tonnage cost vs Bid
- Daily average wait time at plant and jobsite vs historical average for a project
- Per Round Time Tracking (how long it takes all drivers to complete a round trip)
- Total tons loaded vs estimated
- Mill and Fill:
- Load Count (Millings)
- Load Count (Asphalt)
- Estimated Tonnage
- Target Average Milling tons per Load
- Cost per ton per ton based on rate input and load count
- Daily average wait time at plant and jobsite vs historical average for a project
- Per Round Time Tracking (how long it takes all drivers to complete a round trip)
- Dirt Jobs:
- Load Count (plant)
- Load Count (other site)
- Estimated Cy (Cubic yards)
- Target Avg Cy per Load
- Cost per Cy based on rate input & load count
- Daily average wait time at plant and jobsite vs historical average for a project
- Per Round Time Tracking (how long it takes all drivers to complete a round trip)The analytics differ depending on job type, which is highlighted below:
Still Need Help?
If you have any more questions feel free to reach out to our support team.
- Email: support@haulhub.com